Client work · 2014 · for Project Boss

Project Boss

Project management for construction companies.

A web app for construction companies to plan their projects, schedule their people and bill for their hours. It began in 2014 as consulting work, the year before I founded Lotus, on top of an open source app I'd written two years earlier.

Built
Rails Web App
With
Rails, ActiveAdmin, PostgreSQL, Sidekiq, React, Heroku
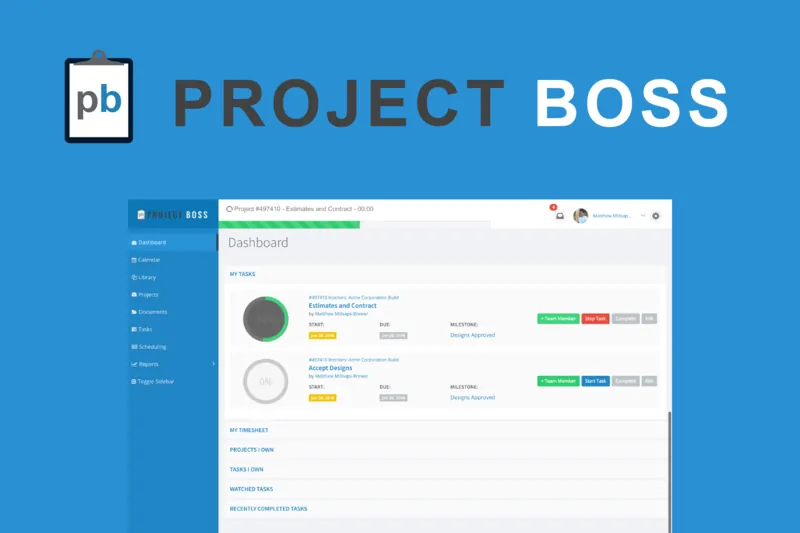
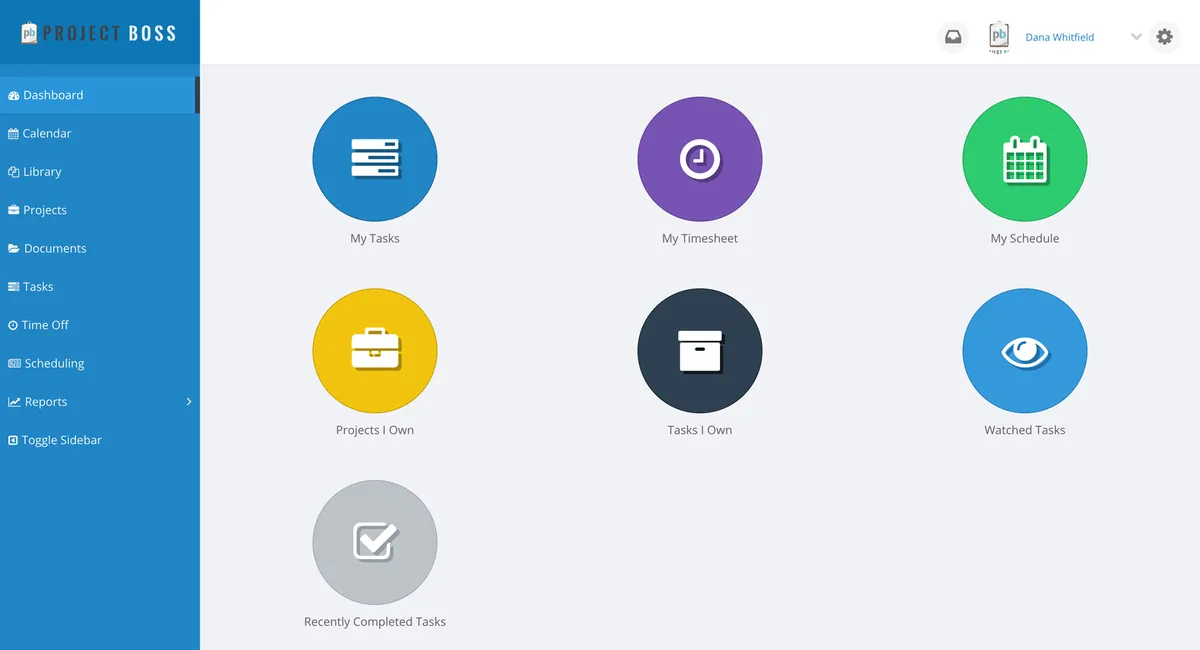
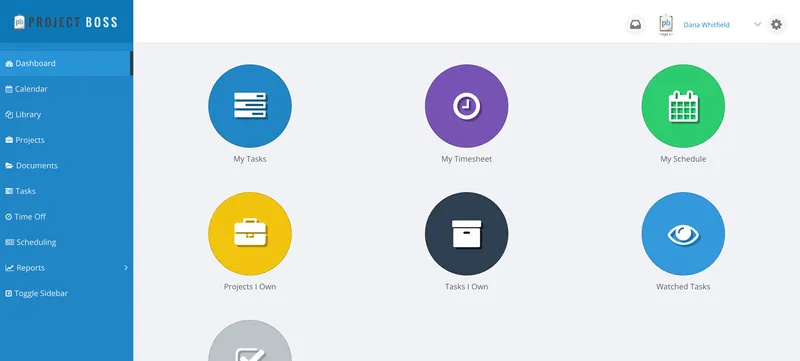
The Project Boss dashboard, with round tiles for My Tasks, My Timesheet, My Schedule, Projects I Own, Tasks I Own and Watched Tasks beside the app's blue sidebar.
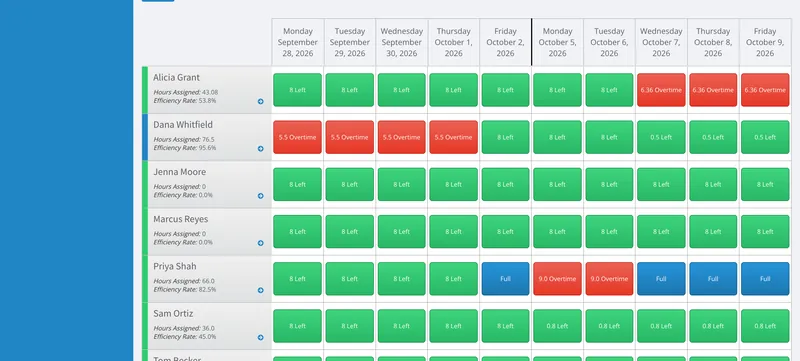
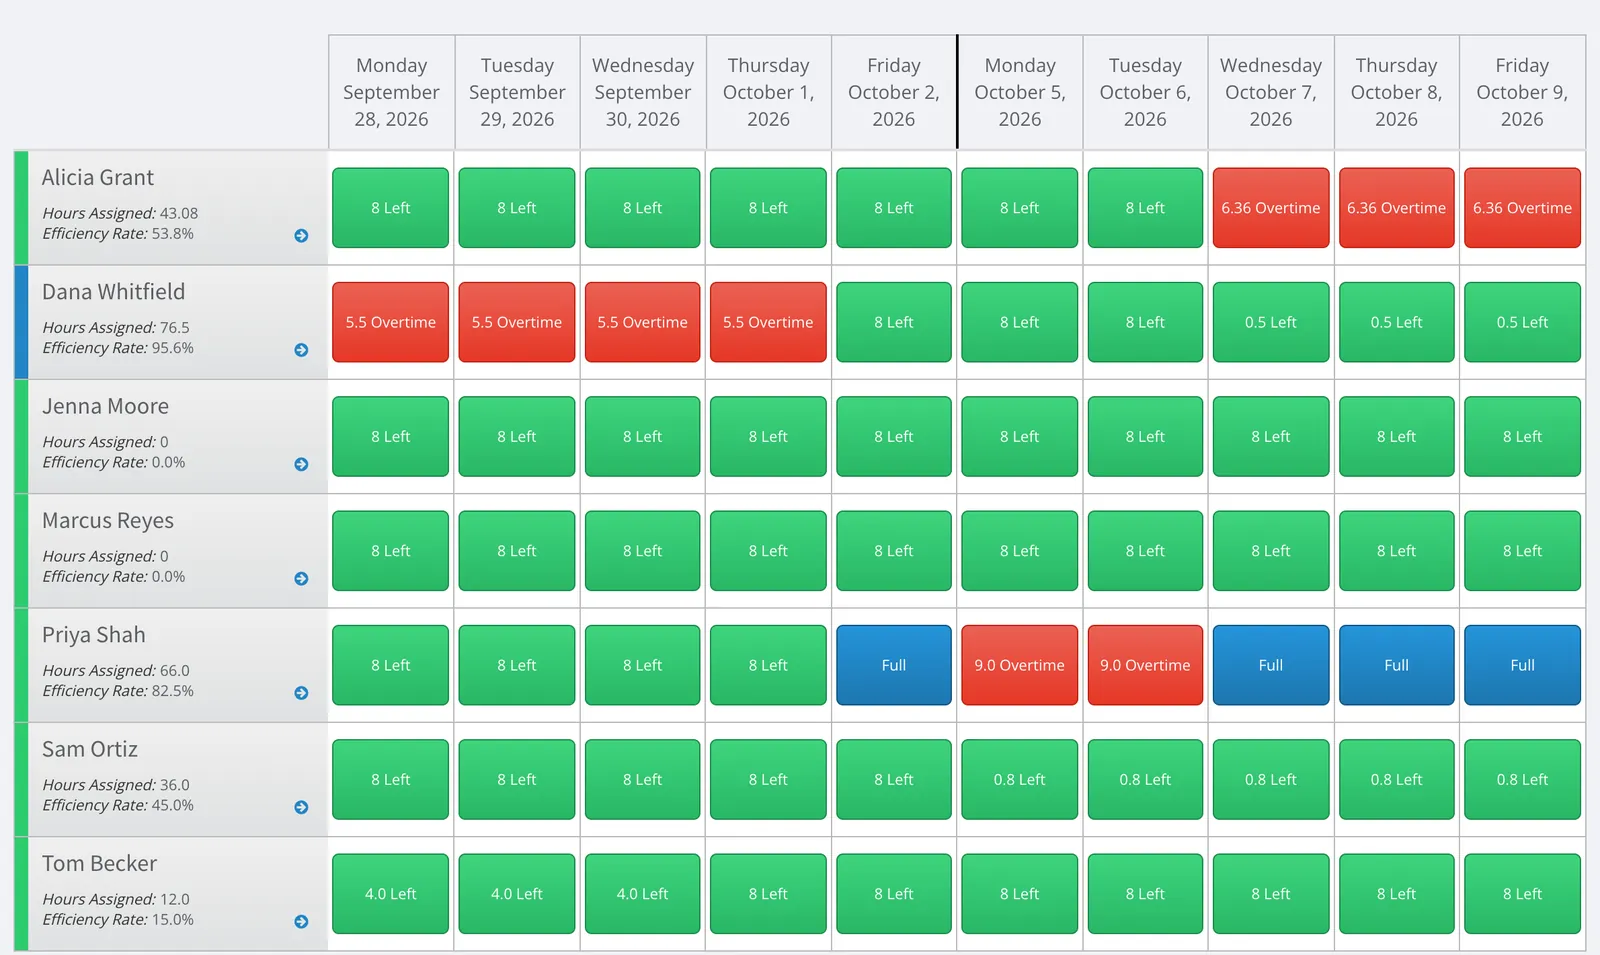
The Schedule: made-up people down the side and ten working days across, each day a green, blue or red tile reading 8 Left, Full or 5.5 Overtime.
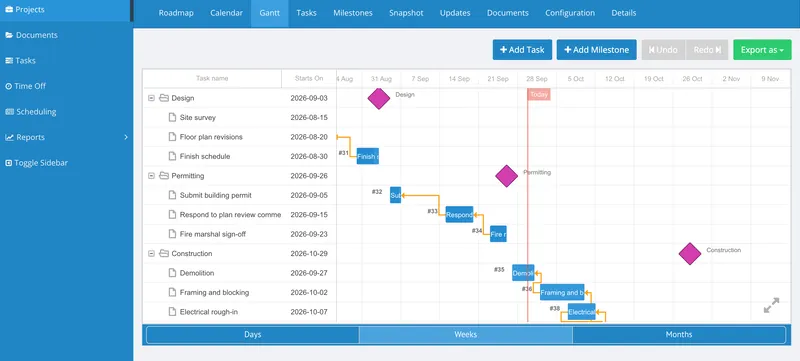
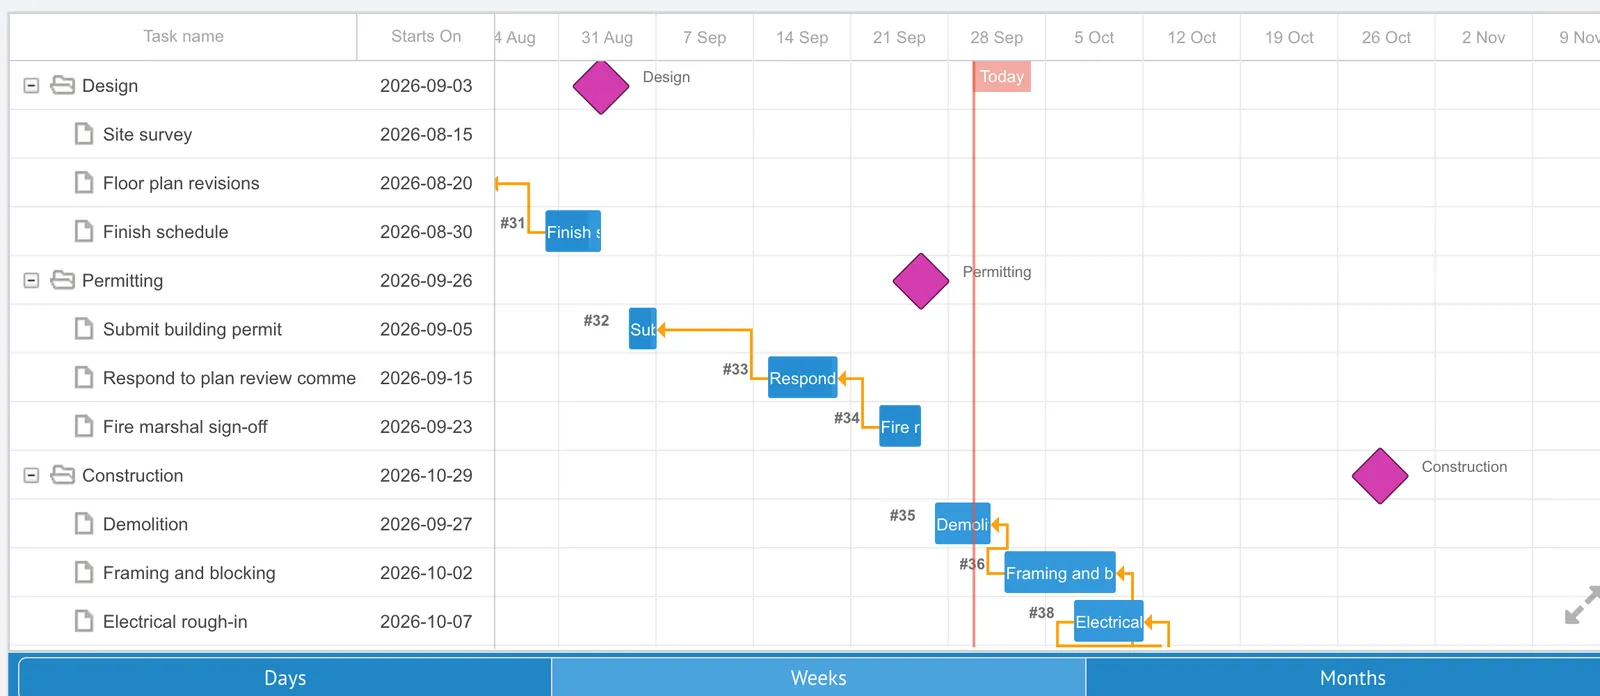
A project's Gantt chart by the week: Design, Permitting and Construction milestones as purple diamonds, with their tasks as blue bars linked by orange arrows.

Two projects for Project Boss · since 2014

  1. 2014 · You’re reading thisProject BossProject management, HR and invoicing, on the web.
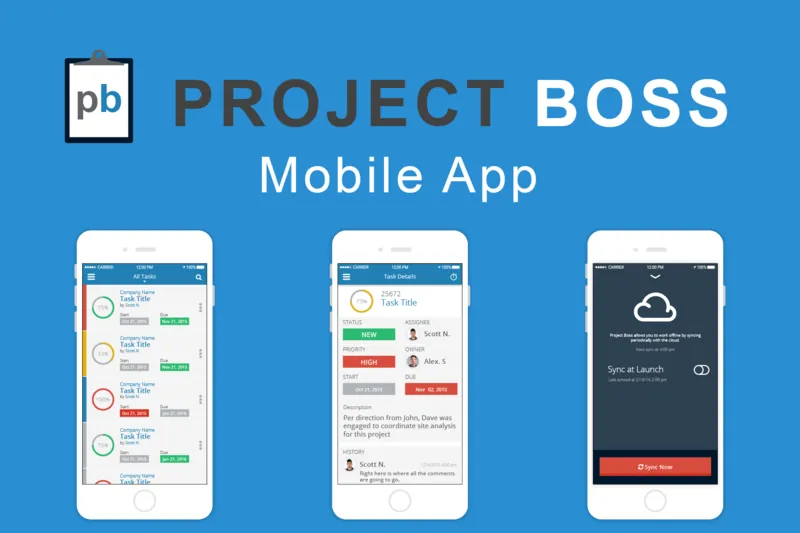
  2. 2016Project Boss Mobile AppDesigns for a mobile app for construction crews, to manage tasks and projects from the field, even offline.Read the case study

The brief

Make it theirs

Replace the older web app a client ran its construction projects on, starting from SprintApp, the open source project manager I had written. It had to hold their own project data and reports, and might one day become a product that other companies could sign up for.

The challenge

Their fields, not mine

The old system had a lot of fields, broken into sections like Due Diligence and Permitting, and a library of documents. Its reports were exported to Excel. SprintApp had none of that, it was built on Rails 3.2 and an ActiveAdmin that had moved on, and it only knew about one company.

What we made

A platform that kept growing

A multi-tenant Rails app where every company has its own address, its own project fields and reports, a two-week workload planner, a Gantt chart, a document library it can share with people outside the company, and invoices that go to QuickBooks Online. I built the first versions, and from 2016 a small team of us at Lotus kept it growing until 2019.

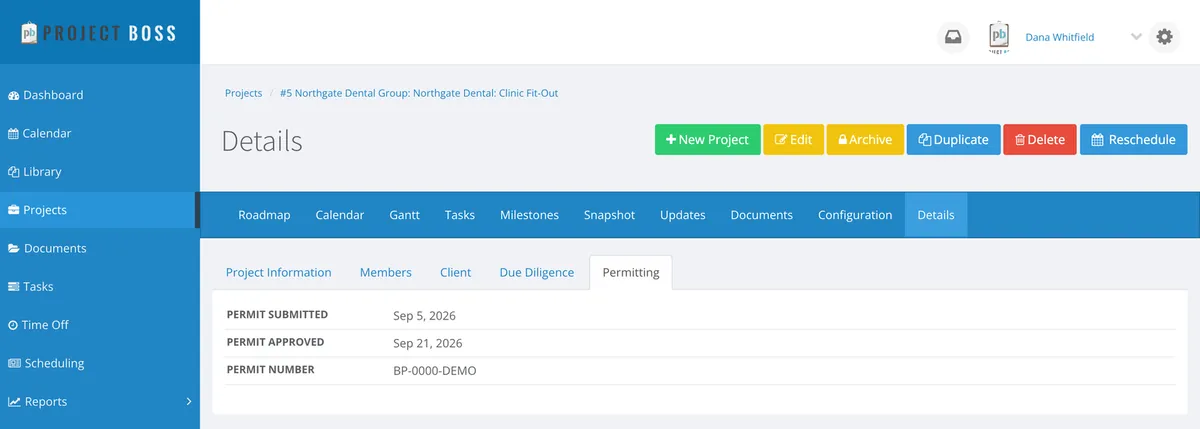
A project's Details page in Project Boss, on demo data: tabs for Project Information, Members, Client, Due Diligence and Permitting, with Permitting open, showing when the permit was submitted and approved, and its number.

Where it began

It Started as SprintApp

In June 2012 I open sourced SprintApp, a Rails app for project management and time tracking, built on ActiveAdmin. It had a calendar, a sprint view of the week’s work, tickets with Start and Stop Timer buttons, and a handful of reports. By July 2014 I’d marked it deprecated: nobody had contributed in a year, and I hadn’t had the time for it, or the need, for even longer.

That October, a client asked about using it to replace the web app they ran their construction projects on. My notes from looking through their old system are mostly questions: projects with a lot of fields broken into sections like Due Diligence and Permitting, a library of documents grouped by section, a schedule of preopening tasks, reports that exported to Excel. I asked whether to upgrade SprintApp from Rails 3.2 to Rails 4 before starting, how important a site that worked on phones was, and whether they wanted to be ready for more than one company from the beginning or leave it for a second phase.

This was consulting work, the year before I founded Lotus. My first commit for them was on 27 October 2014, on SprintApp’s own code.

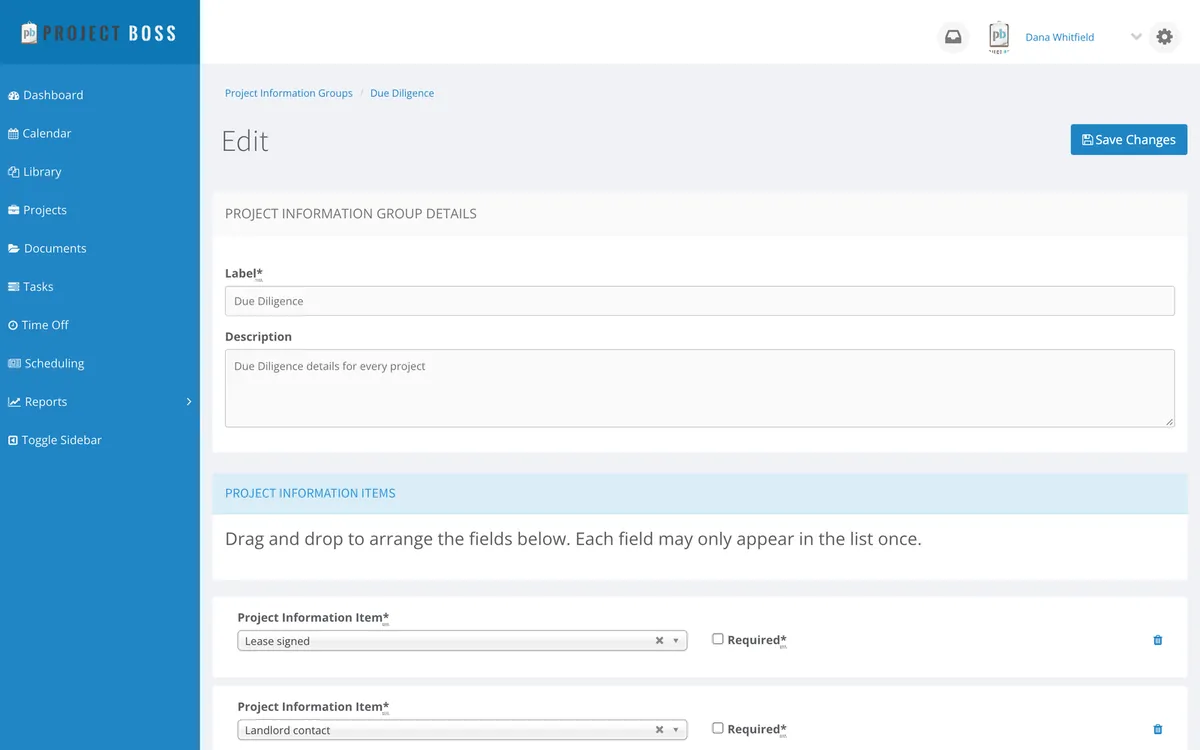
Editing the Due Diligence group of project information in Project Boss, on demo data: its label and description, then its items, Lease signed and Landlord contact, each with a Required box, under a note to drag and drop them into order.

Their fields

Fields the Customer Defines

The first thing I built was the part the old system was really made of: its fields. Rather than add a column for each of theirs, I let an administrator define their own, a date or a piece of text with a hint, and gather them into groups that they can drag into order and mark as required. A group is attached to a project, and each one shows up as a tab of its own when you edit or view it, with a date picker for the dates.

They started out as Data Sets and Data Fields, and in November they were renamed at the client’s request. In the app today they’re Project Information Groups and Items.

Then came custom reports, in December 2014 and January 2015. You pick which fields are columns, which one it sorts on and which way, keep the report to yourself or share it with the company, duplicate someone else’s to start from, and run it against a few projects or every active one, as a CSV or a PDF with its dates colour coded.

The Project Boss dashboard, on demo data: seven round tiles, My Tasks, My Timesheet, My Schedule, Projects I Own, Tasks I Own, Watched Tasks and Recently Completed Tasks, beside the app's blue sidebar.

Many companies

One App, Many Companies

In January 2015 Project Boss stopped being one company’s app. Every company became an account with its own subdomain, and on every request the app reads the subdomain and limits every query to that company’s data, using the acts_as_tenant gem, so one customer can never see another’s projects. The data that was already there moved into the first account, and a new account starts with its own defaults.

The same month it connected to QuickBooks Online, so that a company could sign in to its QuickBooks account from Project Boss and send its invoices there. That July came invoices of its own: pick a client’s billable hours that haven’t been invoiced yet, and they become the invoice’s lines, with the QuickBooks customer of the same name chosen for you.

By May 2015 I could also set up a new company from an existing one, with a task that copies every group of fields across as a template in one go.

The Schedule in Project Boss, on demo data: seven people down the side, each with their hours assigned and efficiency rate, and ten working days across, each day a tile reading 8 Left, 4.0 Left, Full, 5.5 Overtime and the like, in green, blue and red.

The planner

Two Weeks at a Glance

In March and April 2015 I built the Schedule, which answers a simple question: who has room, and who has too much? It shows every person across the next two working weeks, one tile a day, filtered by team or by project.

The sums are straightforward. Each task’s estimated hours are spread evenly across the working days between its start and its end, and each day’s hours are added up and taken from an eight-hour day. Time off and holidays count as hours too, and where time off would push a day into overtime, the task’s hours are moved on to its later days. A tile is green with the hours that are left, blue when the day is exactly full, and red with the hours of overtime. You can also choose to count only the hours a task has left, so a task that’s half done stops filling up the days ahead as if it hadn’t started.

A page like this, with a row for everyone, is slow to build in one go, so the rows load separately, spread across four subdomains, which gets around the limit a browser puts on how many requests it will make to one address at a time.

The sums

Eight Hours a Day

Here are one person’s two weeks, worked out the way the Schedule does it. Framing takes 48 hours over eight working days, so six a day. Plumbing takes 20 over the five days of the second week, so four a day, and where the two overlap, that’s two hours of overtime.

Add or take away a task, or count only the hours left on the framing, and see where the week lands. The person and the tasks are made up, and there’s no time off here; the sums are the app’s.

Priya Shah Two weeks, Monday to Friday

  1. Mon, week 1 2.0 Left
  2. Tue, week 1 2.0 Left
  3. Wed, week 1 2.0 Left
  4. Thu, week 1 2.0 Left
  5. Fri, week 1 2.0 Left
  6. Mon, week 2 2.0 Overtime
  7. Tue, week 2 2.0 Overtime
  8. Wed, week 2 2.0 Overtime
  9. Thu, week 2 4.0 Left
  10. Fri, week 2 4.0 Left

Overtime on 3 days, full on 0, and room left on 7.

A project's Gantt chart in Project Boss, on demo data, by the week: the Design, Permitting and Construction milestones as purple diamonds, their tasks as blue bars, and orange arrows linking each task to the one it waits on, with a red line for today.
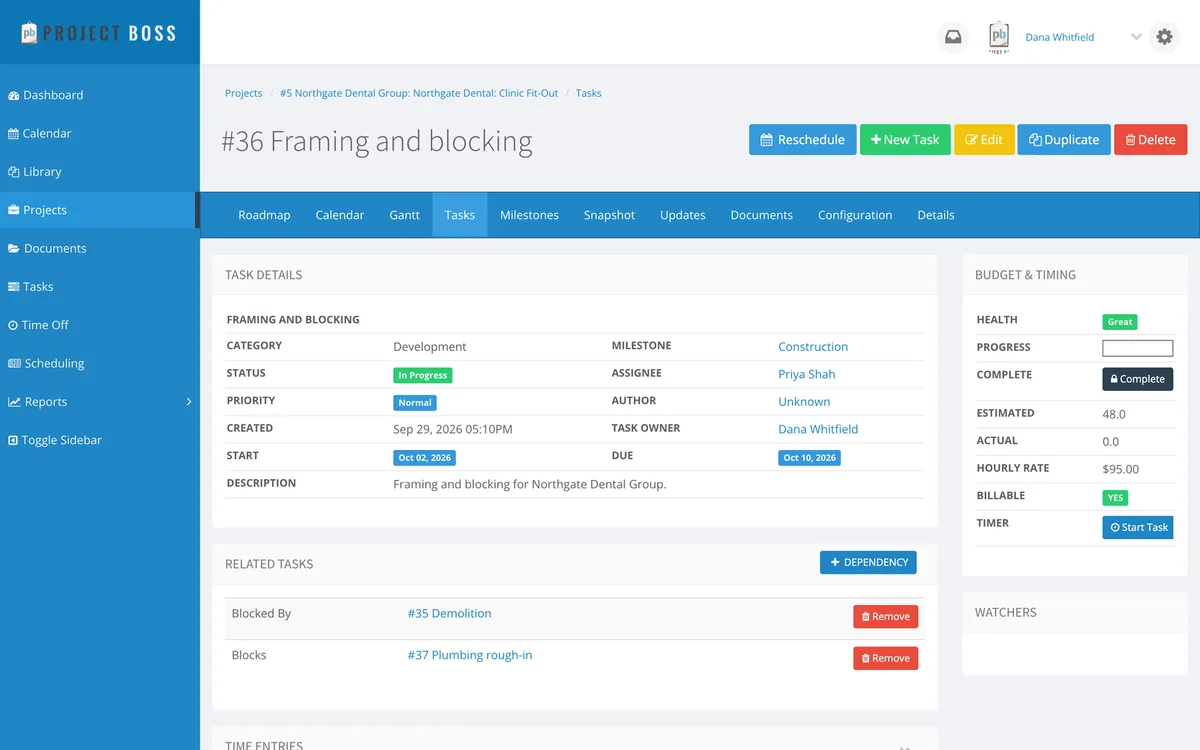
A task in Project Boss, on demo data: Framing and blocking, with its category, status, dates and assignee, a Budget and Timing panel with its health, estimate and a Start Task button, and Related Tasks below, blocked by Demolition and blocking Plumbing rough-in.

The Gantt

Dependencies, Then a Gantt Chart

Construction work happens in order, so in February 2016 a task learned what it was waiting on. One task can block another, or be blocked by it, and the task’s page lists both.

A month later every project got a Gantt chart, built on dhtmlxGantt. Its milestones are diamonds with their tasks beneath them, the links between tasks are drawn as arrows, and weekends are shaded. Dragging or stretching a bar saves the new dates, and the whole chart exports as a PDF, a picture, a spreadsheet or a Microsoft Project file. It turns away the links the rest of the app has no way to store, like two tasks that have to start together, or a link to a milestone.

In 2016 a small team of us at Lotus started working on it too, and that spring we let you create a task straight on the chart and undo and redo a change you didn’t mean. Then, in September 2017, we added rescheduling. Move a milestone and you can choose to move every other open milestone still ahead of you by the same number of days, and their tasks move with them. Move a task past the end of its milestone and you can choose to move the milestone, and the ones after it, along with it. That work runs in the background, so a big project doesn’t hold up the page.

The Craft

Files, inside and out

Every company has a document library, a file manager I built on Webix in May 2015, with folders you can move things between. In the spring of 2016 we gave each project a files area of its own, written in React with Flux, where a file or a folder can be shared with someone outside the company. They get an email with a long, unguessable link, the app counts their views and downloads, and a whole folder downloads as a ZIP that’s put together in the background.

Work in the background

Sidekiq does the slow work, on queues of its own for QuickBooks, scheduling and imports, and a few jobs run on a timer: refreshing the QuickBooks sign-in every day, a daily summary email, and a check every ten minutes for projects that have gone over budget.

Tested

It has 131 RSpec files, most of them for the models and the services, run on Travis CI and later on Codeship.

Kept current

It started on SprintApp’s Rails 3.2 and Ruby 1.9.3, moved to Rails 4.2 in March 2015, and ran Ruby 2.5 by 2019. It ran on Heroku, with a staging copy that could be refreshed from a backup of production, and New Relic watching its performance.

The reports people asked for

Over the years it gathered more than a dozen reports. From a proposal in April 2017, we built two that May: a Late Task Report, listing every active project with a task in the dates you choose that’s still open past its due date, and an Unassigned Resource Report, which marks every working day that someone has no task and no time off.

A team

From 2016 to 2019 a few of the Lotus team worked on it alongside me: the Gantt chart’s editing, editing projects and tasks in bulk, a production report and a division report, and invoices kept against each project.

More for Project Boss

Two projects for Project Boss

All the client work

2014 to 2016

  1. 2014
    Project BossProject management, HR and invoicing, on the web. You’re reading this
  2. 2016 Project Boss Mobile AppDesigns for a mobile app for construction crews, to manage tasks and projects from the field, even offline. Read the case study